Do you know what the statistics of Indian education are?
The statistics of Indian education showcase the latest facts and figures related to the education sector of India. As per the Know India, the literacy rate in India is around 74.04%.
According to the census report of 2011 the enrollment rate in primary, secondary and senior secondary is around 95%, 69% and 25%. The education system in India is mainly controlled by the government of India which falls under the Ministry of Education.
The Indian education statistics were mainly acquired through two sources such as administrative sources and survey sources. Administrative data is collected by the department of the Ministry of Education through kindergartens, schools, colleges, and universities.
On the other hand surveys are the major source for collecting data mainly conducted by the National Sample Survey Office (NSSO) every ten years. The data of the Indian education system represents the current scenario of education provided to individuals.
Table of Contents
- Education in India Statistics – Statistics as per Census 2011
- 1. Overall Literacy Rate
- 2. Highest and Lowest State Literacy Rate
- 3. Adult Literacy Rate
- 4. Urban and Rural Literacy Rate
- 5. Enrollment Rate
- 6. Online Education in India Statistics
- 7. Distance Education Statistics Courses in India
- 8. Educated Unemployment in India Statistics
- 9. Education Statistics in India State-wise
- Statistics of child education in India
- Education Data in India based on Level
- Pyramid Structure of the Indian Education System
- Government Policies & Recent Initiatives
- Conclusion
Education in India Statistics – Statistics as per Census 2011
The educational statistics of 2011 is considered as the latest census report because of comprehensive representation of demographics. Education statistics is mainly required for policy making and implementation as well as for the research process.
According to the census 2011 Indian state Kerala has the highest literacy rate with 96.1% for male and 92.1% for female. On the other hand, Bihar has the lowest literacy rate with 61.8% along with 71.2% for male and 51.5% for females. Here you can check detailed statistics for Indian education.
1. Overall Literacy Rate
The latest overall literacy rate according to the census of 2011 is 74.04%. In which males have 82.14% literacy rate and females have 65.46% literacy rate.
| Gender | Literacy Rate |
| Male | 82.14% |
| Female | 65.46% |
2. Highest and Lowest State Literacy Rate
The Indian state Kerala has the highest literacy rate for both males with 96.11% and 92.07% for females. For the same, Bihar is considered to have the lowest literacy rate with 73.39% for males and 51.50% for females.
| Terms | State | Gender | Percentage |
| Highest State Literacy Rate | Kerala | Male | 96.11% |
| Female | 92.07% | ||
| Lowest State Literacy Rate | Bihar | Male | 73.39% |
| Female | 51.50% |
3. Adult Literacy Rate
The adult literacy rate denotes the education of students above the age of 15. According to the 2011 statistics the total adult literacy rate is 69.3%, in which male has 78.8% adult literacy rate and female has 59.3% adult literacy rate.
| Gender | Adult Literacy Rate |
| Male | 78.8% |
| Female | 59.3% |
4. Urban and Rural Literacy Rate
The urban and rural literacy rate represents the Indian education in rural and urban areas. The literacy rate for both males and females in urban area is likely 88.3% and 74.1%, on the other hand the literacy rate for both males and females in the rural area is low, with 76.9% and 50.6%.
| Terms | Gender | Percentage |
| Urban Literacy State | Male | 88.3% |
| Female | 74.1% | |
| Rural Literacy Rate | Male | 76.9% |
| Female | 50.6% |
5. Enrollment Rate
As per the MoSPI report the GER for both male and female in the primary level is 101.4 and 98.9. The GER for the middle class for both male and female is 95.3 and 87.7 and at higher secondary level, the GER is at 65.8 and 63.8 for both and male and female.
| Class Level | Gender | Gross Enrollment Ratio |
| Primary | Male | 101.4 |
| Female | 98.9 | |
| Middle | Male | 95.3 |
| Female | 87.7 | |
| Higher Secondary | Male | 65.8 |
| Female | 63.8 |
6. Online Education in India Statistics
Online education is growing rapidly after the COVID-19 scenario. Online learning was first introduced in the year 2000, since its launch the online learning has grown to 900%. A research conducted by Syngene Research states that online education is still booming with a growth rate of 9.1% within 2018 to 2025.
In the year 2020-21 online education has seen an upstroke of 500 million students. Even with that growth, online education in India has seen a valuation of Rs. 361.68 billion in the year 2022, and it is expected to reach a valuation of Rs. 837.11 billion by the end of 2028.
| Year | Valuation |
| 2020-21 | Rs. 250 Billion |
| 2022-23 | Rs. 361 Billion |
| 2025-28 (Estimated) | Rs. 837.11 Billion |
7. Distance Education Statistics Courses in India
Distance education is growing rapidly and many institutions are providing distance education. As per the AISHE report of 2017-18 a growth of 11% has been noted in distance learning.
In the year 2014-15 the enrollment rate of students in distance learning was 38,11,723 students and it has grown to 40,31,594 students in 2017-18. Also the number of universities offering distance education has increased by 104%.
| Particulars | Year | |||
| 2014-15 | 2015-16 | 2016-17 | 2017-18 | |
| Total students enrolled in distance education | 38,11,723 | 38,24,901 | 40,89,781 | 40,31,594 |
| Number of Universities offer distance education programmes | 157 | 130 | 114 | 118 |
8. Educated Unemployment in India Statistics
In India, educated unemployment is increasing rapidly, as per the PLFS data of 2023, the unemployment rate for individuals with higher education is 6.5%. Individuals who are illiterate have a low unemployment rate of 0.2%.
Even the rural unemployment rate for educated females is more than males, which is 9.0%, whereas male has 5.6%. However, the unemployment rate over a three year period is slightly decreasing from 8.6% in 2021-22 to 6.5% in 2023-24.
| Level of Education | Unemployment rate 2021-22 | Unemployment rate 2022-23 | Unemployment rate 2023-24 |
| Illiterate | 0.3% | 0.1% | 0.2% |
| Literate & Up to Primary | 0.9% | 0.4% | 0.4% |
| Middle School | 2.5% | 1.6% | 1.4% |
| Secondary & Senior Secondary | 8.0% | 6.6% | 6.5% |
9. Education Statistics in India State-wise
The statistics of Indian education as per the census survey of 2011 the highest literate state is Kerala with 96.2% and Bihar has the lowest literacy rate with 61.8%.
Also, the data collected by the Periodic Labour Force Survey (PLFS) in 2023-24, Mizoram has the highest literacy rate with 98.2% followed by Lakshadweep, 97.3%.
| State | Literacy Rate (%) |
| Kerala | 96.2 |
| Delhi | 88.7 |
| Uttarakhand | 87.6 |
| Himachal Pradesh | 86.6 |
| Assam | 85.9 |
| Maharashtra | 84.8 |
| Punjab | 83.7 |
| Gujarat | 82.4 |
| West Bengal | 81.69 |
| Haryana | 80.4 |
| Andhra Pradesh | 72.6 |
| Bihar | 61.8 |
| Madhya Pradesh | 75.2 |
| Rajasthan | 75.8 |
| Jharkhand | 76.7 |
| Telangana | 76.9 |
| Uttar Pradesh | 78.2 |
| Chhattisgarh | 78.5 |
| Ladakh | 81 |
| Jammu & Kashmir | 82 |
| Andhra Pradesh | 72.6 |
Statistics of child education in India
The top statistics of child education in India are:
1. Gross Enrollment Ratio
The primary gross enrollment ratio is around 93%. The secondary level gross enrolment ratio is 77.4% and the higher secondary gross enrolment ratio is 56.2%. All figures are as per the PIB 2025 data.
2. Dropout Rates
The dropout rates for primary level are 2.3%, 3.5% for the upper primary level, and 8.2% for the secondary level. All figures are as per the UDISE+ 2024-25 data.
3. Gender Parity
The gender parity in child education in India can be understood with the rural literacy rate at 77.5% while the urban literacy rate is 77.5%. All figures are as per the 2024-25 report by Shaksham Foundation.
4. Learning Outcomes
The learning outcomes for child education in India can be understood with the UNICEF (2019-20) data stating that nearly 50% of the primary school children don’t achieve the basic proficiency in mathematics and reading.
4. Children With Special Needs (CWSN)
The total enrolment of the children with special needs (CWSN) in India was 22.7 lakh for FY22. All figures are as per the PIB 2023 data.
Education Data in India based on Level
The data of Indian education are collected mostly on the basis of some level, but the most used data are based on gender, caste and higher education. These levels denote how many people are educated and uneducated.
Basic literacy is the rights of every individual according to the right to education act, but along with that many go for higher education. Here you can check the Indian education data based on some level.
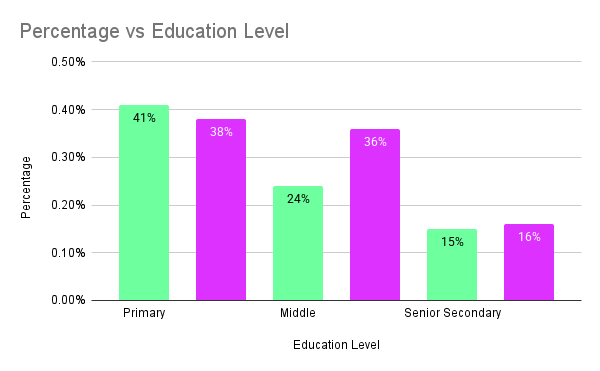
1. Gender Based
Gender based education data represents the number of male and females literate in primary, secondary and senior secondary level. As per the labour force survey of 2022-23, the illiterate number of males were 21% on the other hand 38% of females were illiterate.
For the primary level 41% of male are considered as illiterate and at secondary level and senior secondary level 24% and 15% of male are illiterate.
As per the same survey 38% of females were considered as illiterate, in which 36% of females were illiterate in primary level and 16% in secondary education.
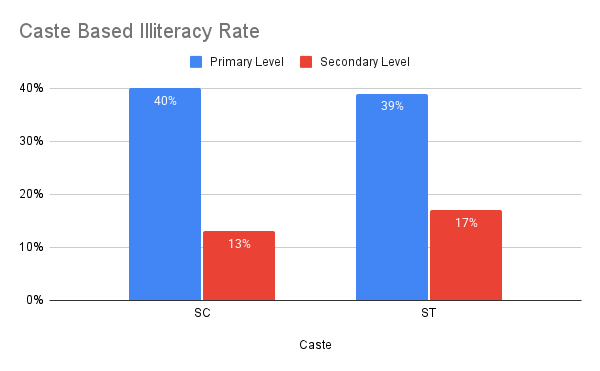
2. Caste Based
Caste based survey is based on a specific community that demonstrates the data of marginalized groups. These data denotes how many individuals from which social group have literacy rate.
As per the NSSO, Labour force survey 2022-23, SC and ST castes have a high number of illiteracy rate, with 41% of SC and 36% for ST. In both primary and secondary level the illiterate number of people for SC were 40% and 13%.
On the other hand for ST it is 39% and 17%. OBC and General candidates have less illiteracy rate at both primary, secondary and senior secondary level.
3. Higher Education
More than 33 million students are enrolled in undergraduate programs with only 5.1 million students in postgraduate program. The GER in higher education has increased to 28.4% from the 2020-21.
At the undergraduate level 34% of students choose Arts subjects, whereas 15% choose Science and 13% Commerce. For the post graduation most people choose Social Science 21% and 15% choose Science on the other hand, Management is chosen by 14% of students.
| Higher Education | Subjects | Percentage |
| Undergraduation | Arts | 34% |
| Commerce | 13% | |
| Science | 15% | |
| Postgraduation | Social Science | 21% |
| Science | 15% | |
| Management | 14% |
Pyramid Structure of the Indian Education System
The Indian education system mostly follows a pyramid structure, which starts from pre-primary education to senior secondary level.
The pyramid structure has a broader base at bottom and narrow at top, which shows the higher number of students or students enrollment at pre-primary level and it reduces with each stage.
In the pyramid structure of education the employment rate is lower. According to data 16% of individuals in urban areas with higher education are unemployed whereas 19% in rural areas. On the other hand, individuals with primary education have only 3 to 6% of unemployment.
1. Pre-primary
Pre-primary level of education basically provides education to students between the age group of 5 to 6 years. Pre-primary level of education mainly consist of kindergarten, nursery school, Anganwadi, Balwadi, and so on.
The availability of online preschool help learners avail flexible and accessible pre-primary education.
2. Primary
Primary level is also referred to as Elementary education, whose main focus was to provide education to students of age group between 6 to 14 years.
Elementary education is the right of every student as per the Article 21A Right to Education Act. According to this right every children’s has an equal and free right to get education.
3. Secondary
Secondary level focuses on providing education to children between the age of 14 to 18. In secondary level children have to appear for public examinations such as SSE and HSE at their 10th and 12th standards.
Secondary level is considered as the most important aspect after clearing the secondary level, students can go for higher education or for employment.
4. Senior Secondary
Senior secondary sometime is also referred to as higher education which focuses on upper level education and graduation. The upper level education mainly consists of Undergraduation, Postgraduation, and Philosophy in Doctorate.
Government Policies & Recent Initiatives
To increase the education rate and literacy rate, the government has introduced various programs and policies. The policies made by government are in focus with equity and quality education.
Since, the independence many education commissions were setup to eradicate the problem related with education. These commissions have implemented various programs and policies such as.
1. NEP 2020
National Education Policy (NEP) 2020 was introduced in the year 2020 with main focus on replacing the old education system of 1986. The NEP 2020 has introduced a 5+3+3+4 system which is divided into four stages known as foundational, preparatory, middle and secondary.
2. NIPUN Bharat
The National Initiative for Proficiency in Reading with Understanding and Numeracy (NIPUN) Bharat is a government education program launched in the year 2021. The main aim of NIPUN is to provide basic education to students between the age group of 3 to 9 years.
3. Sarva Shiksha Abhiyan
Sarva Shiksha Abhiyan is a popular government program launched in the year 2000. Providing compulsory education is the main objective of Sarva Shiksha Abhiyan.
Another main objective of Sarva Shiksha Abhiyan is to develop infrastructures of the school, increasing enrollment rate of students and giving teachers adequate training.
4. Mid-Day Meal Scheme
The Mid-day meal scheme is a popular and successful scheme introduced by the government to increase the enrollment of students. The main of mid-day meal scheme is to provide childrens with nutritious free food in government schools.
This scheme has helped in increasing the enrollment rate of students as well eradicate the problem of malnutrition.
Conclusion
According to India’s educational statistics the literacy and education sectors have improved. The Mid-Day Meal Scheme and the NEP 2020 Sarva Shiksha Abhiyan have helped India’s educational system progressively improve as enrollment and literacy have grown.
However, there are still problems with regional and gender differences, higher-level dropouts and the quality of education.
If we want education to genuinely promote social and economic advancement we must continue to place a strong emphasis on equity, accessibility and skill development. Nonetheless the statistics also draw attention to the problems with Indian education and the low enrollment rate in postsecondary institutions.

You may also want to read